
“Yield Curve” is the name given to the relationship between the yields of different maturities of U.S. Treasury debt. There are desirable yield curves, undesirable yield curves, and somewhere in-between. Frequently when markets perform badly, some blame gets attributed to the yield curve. Although the current situation is not perfect, it is certainly moving in the right direction.
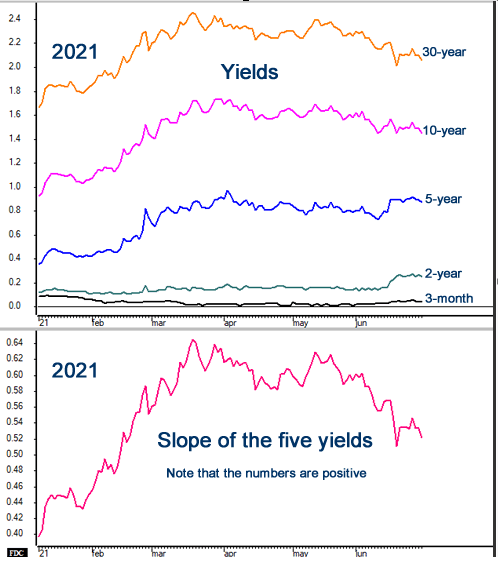
Allow me to illustrate.Here are snapshots of yields in 2021. Note that the lowest yield is the 3-month, which of course has the lowest risk. It is also the yield most influenced by Federal Reserve activities. The remaining (longer-term) yields represent the market’s interpretation of risk and inflation. A yield curve such as this definitely illustrates a pro-growth scenario.
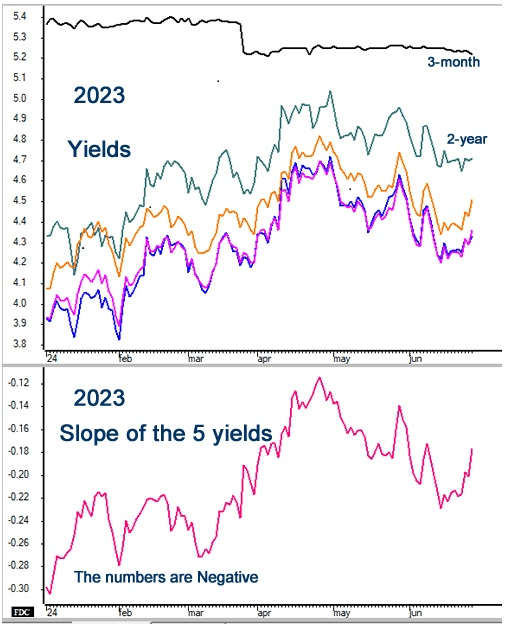
Now let’s examine the same items in 2023. Here the yield on the 3-month Treasury Bill is the highest of all the other Treasury debt. Since the risk inherent in a 3-month obligation is less than that of longer durations, what gives? Here we witness the Federal Reserve’s actions to fight inflation. The most effective way to stop inflation is to discourage borrowing; that also induces recession, but the latter is just a co-casualty of fighting inflation.
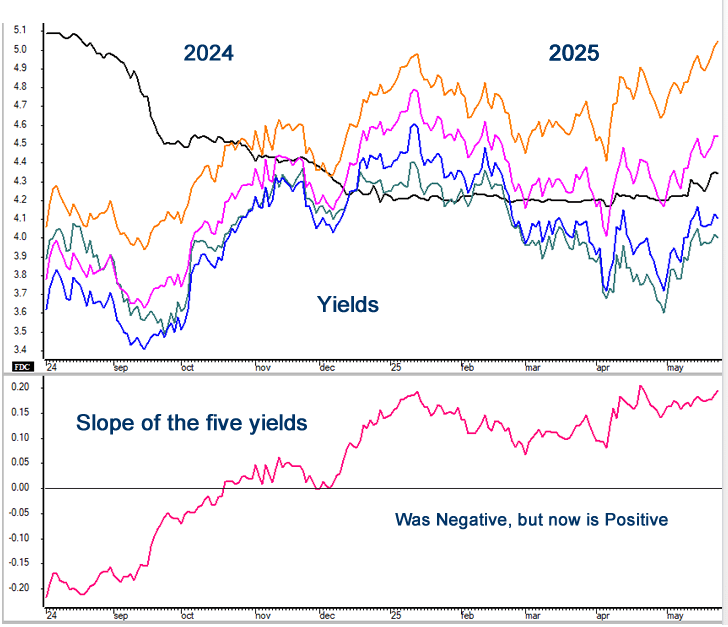
Okay, so where are we now? Here we see that the yields have resumed the desirable pattern of the longer-terms being greater than the shorter-terms. The only exception is the 3-month Treasury Bill. This illustrates the Federal Reserve Bank at work
What could happen that would convince the Fed to back-off its tightening? Inflation could decline, particularly food and fuel. The U.S. could recover from the current recession, which would result in increased international confidence in the U.S. Dollar. All of those could happen and probably will happen. But until they do, the tightening as evidenced by the yield curve will continue to be a drag.