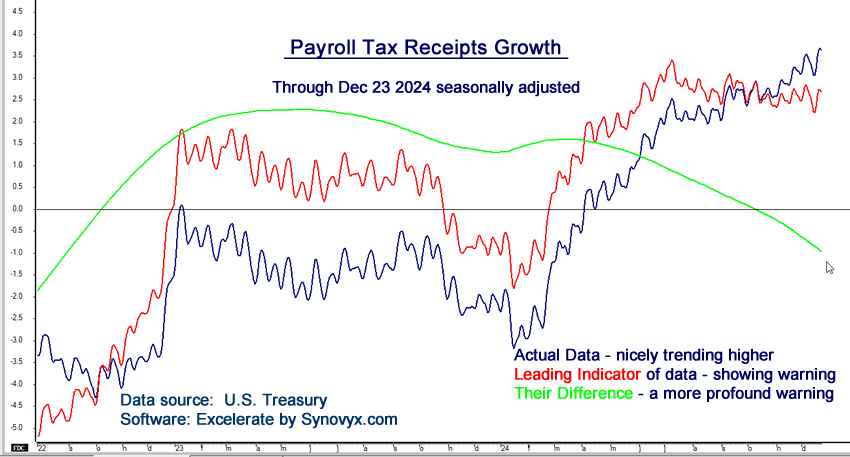
Payroll Tax Receipts: What Are They and Why Do They Matter for Business Intelligence?
Understanding economic growth often relies on accurate, real-time data. One of the most powerful yet underutilized indicators is Payroll Tax Receipts. Every time a company processes payroll, it deducts payroll taxes and submits them electronically to the U.S. Treasury. These deposits appear in the Treasury’s bank account the next day, offering a near-instant snapshot of employment trends and economic health.
While traditional business intelligence tools often rely on government reports, Payroll Tax Receipts provide real-world data without estimates or delays. Here’s why they’re essential for modern data analytics platforms like Excelerate®.
Why Are Payroll Tax Receipts Important?
The U.S. economy is primarily service-based, making Payroll Tax Receipts a powerful indicator of economic activity. As the economy grows, the volume of these deposits increases; during downturns, it decreases. Unlike the Federal Reserve’s monthly unemployment surveys, which rely on phone interviews and statistical estimates, Payroll Tax Receipts reflect actual taxes paid by job holders.
Here’s why this matters:
- Real-Time Data: Payroll tax deposits update daily with just a one-day lag.
- More Accurate Insights: Unlike survey-based reports, this data reflects real tax payments.
- No Seasonal Adjustments Needed: While the Federal Reserve adjusts its data for seasonality, the Treasury’s bank account provides raw, unadjusted figures.
How Seasonality Affects Payroll Tax Receipts
Like many datasets, Payroll Tax Receipts are highly seasonal. Pay cycles—weekly, bi-weekly, semi-monthly, and monthly—create predictable spikes. Additional fluctuations occur with seasonal employment trends, such as:
- Summer Construction Jobs
- Pre-Holiday Retail Hiring
To gain actionable insights, business intelligence platforms like Excelerate® can identify seasonal patterns and apply ETL processes to clean and adjust the data. A 21-period moving average can smooth monthly pay-period effects, while a 10-period average can account for bi-weekly and semi-monthly variations.

Historical Insights and Long-Term Trends
Payroll tax data dates back to 1997, providing a rich historical dataset for trend analysis. Unlike most Federal Reserve reports, which have a three-week lag, Treasury data offers daily updates, empowering businesses to make timely, informed decisions.
Unlock the Power of Real-Time Data with Excelerate®
For organizations equipped with business intelligence software, Payroll Tax Receipts become more than just numbers—they transform into actionable insights. With Excelerate’s cloud analytics and predictive data processing, you can:
- Track Job Growth: Monitor employment trends in near real-time.
- Adjust for Seasonality: Use advanced ETL workflows to remove cyclical noise.
- Enhance Decision-Making: Access accurate insights without waiting for monthly reports.
Ready to leverage payroll data for smarter decisions?
Discover how Excelerate® simplifies data processing, transforms raw datasets into clear insights, and enhances your business intelligence platform.
